The Rapid Elearning Blog

The Rapid E-Learning Blog - information overload

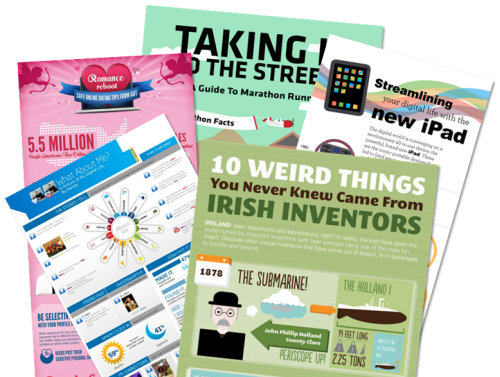
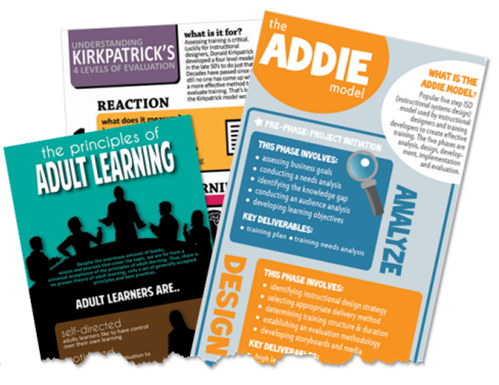
Infographics are the hot! They catch your attention because they look great and have strong visual hooks.

I like them because they remind me a little of I Spy where you get to explore a busy graphic and search for interesting nuggets of information. Of course, not everyone’s a big fan of infographics.

There are many parallels between infographics and elearning. They both share information in a visual medium. Those who design infographics start with lots of information and distill them to a few essential points. That’s very similar to what we do when our subject matter expert hands us a 300-slide PowerPoint file to be converted to an elearning course.

For the person who desires to learn more about visual design and processing lots of information, infographics are a great source of inspiration. Let’s look at what makes them so effective.

Keeping it Simple

If you think about it, infographics are not much more than vertical slide shows. That’s right. They’re really no different than PowerPoint slides. But instead of clicking forward horizontally, they’re stacked nice and neat in a vertical column.

The Rapid E-Learning Blog - linear slides

The Rapid E-Learning Blog - vertical slides

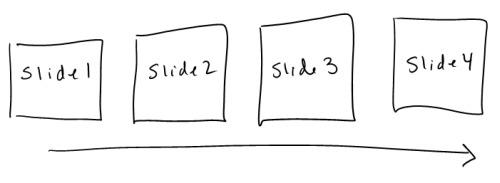
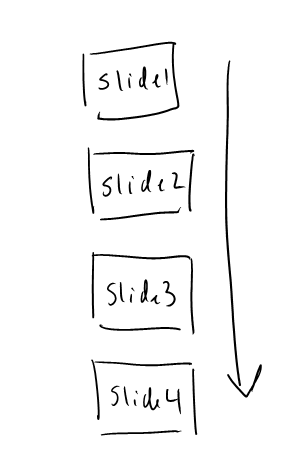
Compare this cool infographic from Paycor to the same content laid out in PowerPoint slides.

The Rapid E-Learning Blog - example of an infographic

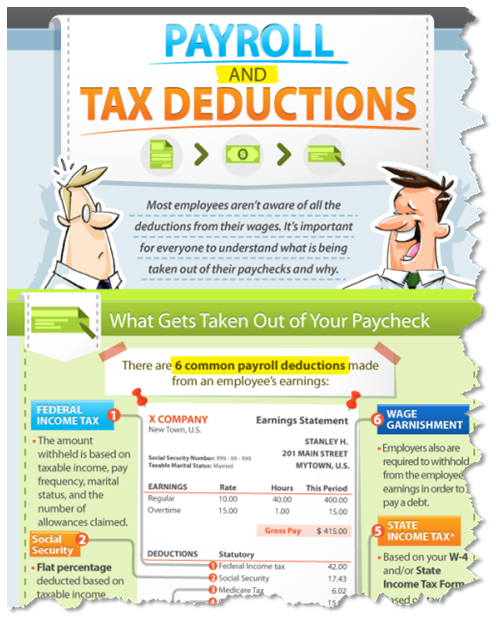
Click to view the entire Paycor infographic.

The Rapid E-Learning Blog - infographic content in an elearning course

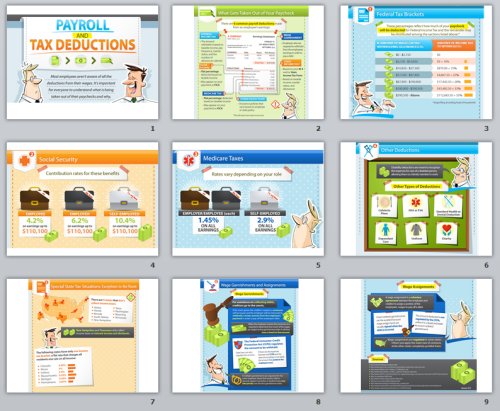
As you can see, the content is broken into very specific sections that are stacked and separated by color headings. They’re not any different than what you normally see in a PowerPoint slide template.

What Does it Mean for Elearning?

The need to share Information drives a lot of elearning; and usually there’s way too much information. So we tend to over inform which makes it hard to focus on the critical information. On the flip side, infographics do a great job focusing on key points of information. Understanding more about them will help us build better elearning.

Fast Company featured a video that explains the case for infographics. As you watch the video, see if you can identify common graphic design concepts like contrast, use of color, and flow of information.

The Value of Data Visualization from Column Five on Vimeo.

What Makes an Infographic?

There are many parallels between infographic design and elearning. Making it a habit to view infographics is a great way to learn about visual communication. They may even inspire some template and layout ideas.

Here are two good sites if you want to regularly review nice infographics:

Here are some elements of infographic design that I find parallels what we do in elearning:

Focused information: It’s all about sharing information and making it memorable. Many elearning courses have too much data on single slides. Infographics do a great job weeding out irrelevant data. This keeps them focused.

The Rapid E-Learning Blog - infographic examples

How can you apply what you see in the infographics to your own courses? Instead of writing a title on the screen with a list of bullet points, write a single sentence that makes the point. Use that sentence to guide the visualization of the information.

Data visualization: Infographics have a visual hook. In some ways coming up with the visual hook is more art than anything else. So how do you learn to do a better job creating the right hooks? The key point is the data. Let the data tell the information. If you have to explain the data, then it’s wrong. The data should do the talking.

The Rapid E-Learning Blog - infographic data visualization

Let infographics inspire some ideas. I also recommend the visual design mind mapping exercise we do in our workshops. The output is very similar because you determine a visual theme with the right colors, design elements, and typography.

Color schemes: Most infographics have a visual hook and use bold colors and elements that really pop off the screen. These techniques also work with your elearning screens. In fact, I’d start by finding an infographic you like and then replicate the layout on the elearning course screen. That’ll give you some practice playing with layout ideas and colors.

The Rapid E-Learning Blog - bold colors and fonts used in infographic design

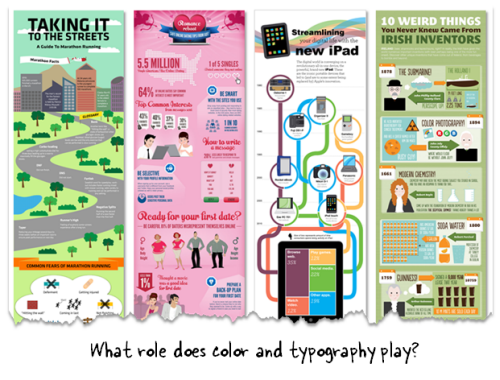
You don’t want the colors to compete with the information. Limit colors to just a few. Most infographics have a background color and then some other colors to create visual breaks between the sections. These can be headers or simple changes in the background.

There are many sites that will help with color schemes. Here are a few:

Bold fonts: Fonts are interesting because they display text that we read. But they’re also graphic elements that convey meaning and speak to your visual voice. We learned about this in an earlier post where we matched fonts to images.

The Rapid E-Learning Blog - what's the right font to match your course

Click here to view the demo.

You’ll notice that infographics are very deliberate in how they use fonts. You can learn to do this using the mind map activity. It helps know what fonts to use.

Once you know what type of font you need, go to a site like Dafont or Font Squirrel to search for the right font. If you need some good free fonts, check out this post where you learned how to get 150 free fonts from Google web fonts.

Icons & clip art. Infographics are also iconic. They find a visual hook, pair that with the right colors and fonts and end up with a visually intriguing and memorable graphic.

Most of us aren’t graphic designers and we don’t always have access to the graphic design resources we need to build elearning courses, let alone an infographic. But that’s OK.

There are all sorts of free icons and vector images that you can use to help in your course design. The key is to stick within a single style so that you don’t get that discordant Frankencourse look.

Even if all you have is clip art you can still find a single style and build your images from that. Check out this post where I used a single clip art style to build my elearning course template. You can do the same thing with your infographics.

The Rapid E-Learning Blog - use PowerPoint and clip art to design infographic style

Here are some resources to find free or low cost icons and vectors. Before using them make sure to check out the license agreements. Some lame companies entice you to free resources and then put all sorts of restrictions on how you can use them. In my book, free should be free!

Also, subscribe to sites like App Sumo and Might Deals. They usually offer some free or very low cost access to all sorts of graphics.

Building an infographic is a great way to practice compressing information into essential points. It also takes you away from the elearning mindset which can help shape a fresh perspective on your content. Practice building an infographic. It can only help you later in your course design. I like what Nicole Legault did on her site:

The Rapid E-Learning Blog - good examples of elearning aand training infographic

As you can see, there are many similarities between infographic and elearning course design. Both require weeding through data and drawing attention to key points and essential information. And since they’re both visual mediums, they are similar in their design elements, fonts, and color schemes.

While you may never build an infographic, making it a habit to review them is a worthwhile pursuit that can inspire your own elearning course designs.

Events

Free E-Learning Resources

Want to learn more? Check out these articles and free resources in the community.

Here’s a great job board for e-learning, instructional design, and training jobs

Participate in the weekly e-learning challenges to sharpen your skills

Get your free PowerPoint templates and free graphics & stock images.

Lots of cool e-learning examples to check out and find inspiration.

Getting Started? This e-learning 101 series and the free e-books will help.


42 responses to “How Can Infographics Produce Better E-Learning Courses?”

Hey Tom,

Great post (as usual). Thanks for mentioning my blog and for showing my infographics in your article. It’s so funny that a few short years ago I was an e-learning newbie,who became inspired by your blog.

On the topic of infographics, I think it’s important not to be intimidated by the “rules” of making infographics. I’ve read a lot of “Infographic Do’s and Don’ts” and according to many, my graphics may not “officially” be infographics because they don’t always contain data/numbers/statistics. I make infographics because I like being creative and I like learning. Mine are mostly just a fun, visual representation of information, mostly through text but with some graphics/icons. Forget about the do’s and don’ts and just have fun and learn new things. There is no need to spend hours sifting through numbers and stats and creating complex pie charts and bar graphs. As a matter of fact, for newbies making infographics it’s probably better to choose a simple concept!

That’s my two cents! 🙂

[…] Originally posted here: How Can Infographics Produce Better E-Learning Courses? » The Rapid eLearning Blog […]

March 27th, 2012

Love love love love! Going to try this now!

March 27th, 2012

Tom, What a great subject. A year or so ago I became obsessed with the book, “Information is Beautiful” (original British title)/”The Visual Miscellaneum” (US version) which looks at data visualization. The author, David McCandless, did a short talk at TED on the beauty of data visualization which really got me thinking about how to incorporate more infographics in our elearning.

Thanks for the additional resources. I am so stoked! Thank you for inspiring me week after week!!

@Kristin: that’s a good video, forgot all about it.

March 27th, 2012

Tom,
You are preaching to the choir on this one. I’ve been trying to use more information graphics or interactive information graphics in my work. I work for a healthcare organization. The biggest complaint is staff doesn’t have time to complete/do education. My hope is that information graphics make it easier for staff to organize information in their heads. I’m just at the beginning of my quest. It will be an interesting year to see if the concept catches on.

IMO infographics can also be a great way to start exploring a topic since they provide the keypoints in a form which is easy to access.

After reading your post I also thought that actually creating an infographic could be an interesting new form of exercise within e-learning, because it forces the learners to visualize the keypoints of what they’ve learned.

I think the Paycor infographic works great too but a lot of the time infographics can’t be pulled apart into slides like this one. It’s surprising though that it works so well either way. Does that make one way of creating infographics better than the other?

Very good write Tom!
I think this is an essential element in instructional design.
Edward Tufte is a noted developer on the graphic display of information. I attended one of his seminars and it changed my entire perspective. His books are amazing and his web site is pretty terrific too.

http://www.edwardtufte.com/tufte/

Pete

@Sofie: most of the infographics I see have very clear delineation from one group of info to the next. In that sense, they are not much different than stacked slides (but obviously they look nice). But of course, not all of them are that way. I just used the slide analogy to help simplify what people are seeing.

@Pete: thanks for the link. Tufte’s stuff is good.

Hi Tom! You never cease to amaze me. Thank you so much for sharing with us. Some months ago I began using interactive infographics for a project. I dare write yours are cooler!

I’ll be checking out the tools you recommend and shall keep you posted!

Best Regards,

Ernesto

Thanks for a great post on Infographics and showing its parallels to eLearning. All said and done, Infographics, a powerful way to communicate the essence of data, can lose its value when too much color and confusion are put into it and simplicity lost. Also, rather than guiding to get the most from the data, the audience may be forced to look at the data as the Infographics author and artist want; similar to the newscasters interpreting the news for us rather than just reporting it and let us draw our conclusions.

@KalS: good points…I’d add that while the infographics do have a bias, most likely all information does (even if we think we’re discovering it on our own). Check out the TED video link in the comments. I think he does a good job showing how data visualization is a great way to help us better understand relationships between data.

Thanks for such information.

We, LearningLeads Education develop high quality content for our global clients.

This information will help us to develop better content.

Thanks so much.

Thanks!
Very, very good blog! And so much useful information – links, tips and advices.

[…] post originale di Tom Kuhlmann sul “Rapid E-Learning Blog”. Il post originale è disponibile qui jQuery(document).ready(function($) { […]

Leggi la traduzione autorizzata in italiano del post qui:

http://www.mosaicoelearning.it/blog/?p=1715

Truly inspiring! It’s sparked ideas on how to go beyond elearning,using infographics for bite sized nuggets of learning. I’m thinking of using it to develop a Sales Toolkit. A great way to work on my graphic design skills.

Tom,
This is a very comprehensive post. You hiot all the right buttons and have showed all educators how to incorporate info graphics into learning. Thanks for the tips and links. This is a post that will benefit newbies as well as evolved educators.

Using info garphics in an e- learning program makes helps incorporate the tactile and visual learning. infographics are a great way to bring context to content.

I get a lot from your blog and am grateful to you and everyone who posts. This one CHANGED MY LIFE! I have so many more ideas! Infographics, job aids, supporting materials that can be used by the people at the time and place they need them!! I can’t wait to get started. Thank you.

cool! site I am a graphic designer and I feel that infographics is an important part of design and education

March 29th, 2012

Hi Tom,

As ever your blog is like opening a Pandora’s box. Never short of new learning and inspiration. Using info garphics in an e-learning, it’s so amazing… these days lot of clients ask for IGs. Cost saving is one imp factor. More over, for rapid development tools it works far better than using images.

I agree the IGs should be used as value edition, KISS (Keep It Simple & Short)works better than eye candies that will dilute the efficacy and purpose.
Thanks again for giving us something to experiment with.

Love IT! I’ve been contemplating the best way to communicate the launch of a new tool and all the required info: what it is, how to access, how to get support, etc. This post has defnitely sparked some ideas – going to give infographics a try! Thanks!

Whilst I create infographics, I am also a fan of very detailed charts (eg http://bit.ly/HkmMea).

Whilst the infographics mentioned above present the information to you in a quick and easy way, detailed charts draw you in and encourage you to follow lines, spot colours, pick up on themes, draw conclusions and interrogate the information yourself.

Depending on the age/group you are teaching, an element of investigation is a large part of learning.

As a creator of both kinds, I must say they are a lot of fun to create if you have the right information!

[…] Ein praxisnaher Artikel, der Web-Design und E-Learning miteinander verbindet. Wobei es im Kern ein Appell an alle E-Learning-Gestalter ist, sich mit dem Format “Infographic” auseinanderzusetzen und inspirieren zu lassen: sowohl von der Kunst, Informationen auf den Punkt zu bringen, als auch vom Umgang mit Farben, Schriften, Motiven, Clip Arts uw. Mit vielen Links auf weitere Ressourcen. Tom Kuhlmann, The Rapid E-Learning Blog, 27. März 2012 […]

[…] info graphics into your module to make it easier for the learners to comprehend. This blog called Rapid eLearning I would strongly recommend you to visit their […]

March 31st, 2012

This was a very enlightening article! I found it particular interesting since I am currently learning Adobe Captivate as one of my last classes at Roosevelt University obtaining my MA in Training and Development. Infographics will add a bit more variety/creativity in authored training modules.

Excellent post as always – thank you!
An infographic that has always caught my imagination for its simplicity and ease of understanding is Beck’s map of the London Underground (Tube)designed in 1931. The modern version can be downloaded as a PDF at http://www.tfl.gov.uk/assets/downloads/standard-tube-map.pdf

I often think that to build the infographic while talking/ discussing the subject is a fascinating idea, building the infographic as the course progresses would give the learner a reminder or revision document and emphasise the important points of the course.

For an example of developing infographic plus talk (quite complex infographic) how about Sir Ken Robinson’s talk on changing education paradigms http://www.youtube.com/watch?v=zDZFcDGpL4U&noredirect=1

Enjoy!

To add to the conversation, here’s a post from Connie Malamed that I came across last year, titled “Infoposters Are Not Infographics”:

http://understandinggraphics.com/visualizations/infoposters-are-not-infographics/

I think it’s interesting to think about the distinction (even if you don’t agree with it), based on what purpose the graphic serves in your learning design.

Thanks for the post!

[…] How Can Infographics Produce Better E-Learning Courses? » The Rapid eLearning Blog […]

[…] Via http://www.articulate.com Share this:TwitterFacebookTumblrPinterestLinkedInDiggEmailLike this:LikeBe the first to like this post. […]

[…] Via http://www.articulate.com Share this:TwitterFacebookLike this:LikeBe the first to like this post.   Leave a comment […]

April 10th, 2012

Really nice article, especially loved the resources you’ve added. Thanks Tom

April 21st, 2012

Excellent Tom! Hey, check out nerdgraph.com. I just came across them.

Tom, I think you may have a broken link in the font personality quiz – I see a little broken image icon.

I missed this one the first time around – thanks for the great resources. I’ve been hoping to free up time to experiment with making infographics this summer.

@Kelly: thanks for the heads up.

[…] about how these visual representations of data and information can be instrumental for instruction? Tom Kuhlmann explored the topic in regards to e-Learning in his blog post a few months ago.  In his post, he provided tips for […]

December 9th, 2012

[…] How Can Infographics Produce Better E-Learning Courses?, Rapid E-Learning Blog (Mar 27) If you are thinking about creating an infographic on an issue or topic, this article will show you how and show you to some great examples. Stephen Abram has leads and advice in this post on Advice: Getting on the Infographic Bandwagon (Mar 12) And if you want to see even more, just search for infographic at Pinterest. This entry was posted in Information Visualization by Gwen. Bookmark the permalink. […]